
When issues are reported to customer support, the first thing we do is try to replicate it. This is why we want to know which device you were using, which browser you were using, which project you were working on, which buttons you clicked, and so on.
In some cases, we may not be able to replicate the issue, meaning, we are not seeing any bugs or errors on our end. This is great news for Quiltster but it doesn’t solve the issues you might be seeing on your end. But don’t worry! We can still try to help!
The next phase of troubleshooting situations like this requires a little assistance from your side. The most helpful thing is to send us a screenshot of the error codes from the browser. This requires opening an “inspect window” to see error codes on your browser. How you access the inspect window depends on your browser.
Since we recommend using Google Chrome while using Quiltster, the instructions provided here will be specific to Google Chrome.
How to Open an Inspect Window
- Log into Quiltster.com
- Go to the page where you experience the issue.
- Right-click anywhere on the page (preferably in a blank area of the page) to bring up a menu.
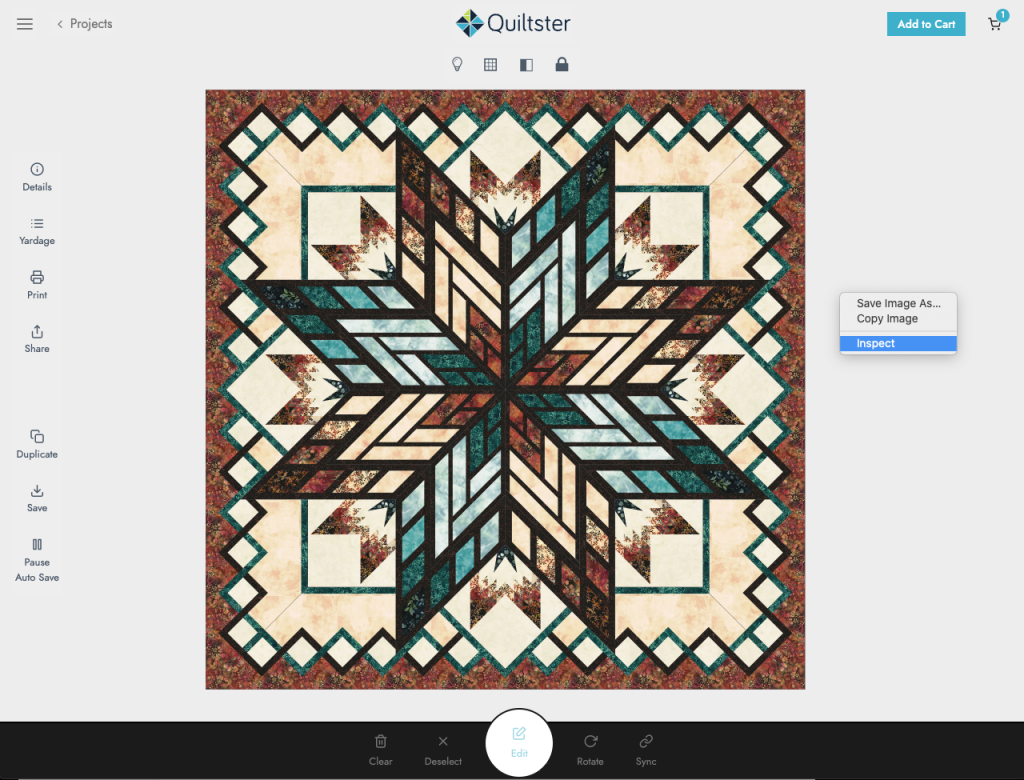
- On this menu, choose the option that reads, “Inspect” or “Inspect Element”. This opens a window showing a bunch of code. That window has it’s own menu at the top. Click Console.
- Now perform the action that caused the error. When you do this, the inspect window will display error codes in red.
- Screenshot this entire page and email it to customer support at info@quiltster.com for further investigation. We may ask you for a full Bug Report Form so please consider sending in this form ahead of time to expedite a solution. You can attach your screenshot image to that form as well.